---
title: "In-vivo fast optical measurements of leaves"
subtitle: "Walz LSA-2050, Force-A Dualex, SPAD, and similar instruments"
author: "Pedro J. Aphalo"
date: 2026-05-07
date-modified: 2026-05-21
keywords: [Walz LSA-2050]
categories: [measurement and control]
editor:
markdown:
wrap: 72
code-fold: true
format:
html:
code-link: true
code-tools: true
bibliography: lsa-dualex-mpm.bib
abstract: |
Comparison of the Walz LSA-2050 handheld leaf analyzer to earlier instrument designs. This is preliminary assessment based mainly on specifications, scientific and technical literature and the author's user experience. It is based on long-term experience with the use of the SPAD-502 chlorophyll meter from Konica-Minolta, the Dualex 3.1 and Dualex 4 dual-excitation instruments from Force-A and recent use of the MPM-100 multiple wavelength pigment meter from Opti-Sciences and the LSA-2050 from Walz. I also show how to import the data logged by the LSA-2050 into R for further analysis.
draft: true
---
## Introduction
All *in vivo* measurements based on estimating leaf transmittance when expressed
as concentrations are on a unit leaf area basis. Given that many variables in
the growing environment affect specific leaf area (SLA) and leaf water content,
differences in chlorophyll concentration between treatments depend strongly on
the base of expression. In practice, the direction of a response to a treatment
can be opposite when concentrations are expressed per unit area and per unit
dry-mass or per unit fresh-mass.
Leaves have a heterogeneous internal structure with many gas-liquid and
liquid-solid interfaces. These interfaces scatter and reflect light while
traveling inside a leaf. This lengthens the path of photons within the leaf
enhancing absorption by pigments and altering the relationship between
absorbance and concentration compared to the same concentration of pigments
in a homogeneous solution. Because of this, the methods described below,
when used to estimate concentrations depend on a calibration that is affected
by the anatomy, water content and even recent illumination of the leaf.
### Leaf transmittance
Chlorophyll concentration can be estimated based on the transmittance of the
leaf at specific wavelengths where Chlorophyll is the main absorber of light
[@Parry2014]. A leaf differs from a solution in that the chlorophyll
distribution is not homogeneous. Not only there are cells, cell walls and
vacuoles in cells but chlorophyll is located in the chloroplasts, and the
location of chloroplasts within mesophyll cells changes in response to
illumination. The changes in transmittance can even be used to study chloroplast
accumulation movements [@justyna]. Thus, the relationship between chlorophyll
concentration and light transmittance varies to some extent depending on the
irradiance and colour of recent illumination [@Hoel1998], specially blue light
sensed by phototropins results in chloroplast accumulation [@xxxx]. This has
been described as a source of errors in chlorophyll measurements with the
SPAD-502 instrument [@xxxx], but as this is an optical phenomenon in the plant
it can be expected to affect all the instruments assessing chlorophyll based on
leaf transmittance.
The concentration of chlorophyll together with the lengthened path of photons
inside a leaf due to scattering, makes leaves very effective absorbers such that
transmittance at the wavelength of maximum absorption by chlorophyll is
extremely low, making the measurement of high concentrations of chlorophyll
_in-vivo_ with the SPAD-502 error-prone. The Opti-Sciences CCM-200 and the
Apogee MC-100 chlorophyll meters use similar wavelengths as the SPAD-502.
The Dualex 4 introduced the approach of using a longer wavelength, were
transmittance is higher but still mainly dependent on chlorophyll and little
affected by other pigments and metabolites. This decreases measurements on
healthy leaves with high concentrations of chlorophyll. The MPM-100 uses an
approach and wavelengths similar to the Dualex 4 and the MPM-100/S uses an
approach similar to the SPAD-502.
The light scattering within leaves decreases the apparent transmittance
even in the absence of absorbing pigments. This effect is estimated by
measuring the apparent transmittance of far-red or near-infrared light
by the leaf, as at these wavelengths absorption by pigments is minimal.
Scattering is almost complete in leaves, and in the far-red region, because
of the absence of absorption by pigments, approximately half of the incident
light exits the leaf through each epidermis. The different instruments
measure the attenuation of radiation in this region as a reference.
For estimating chlorophyll concentration, the instruments described in
@tab-leaf-tfr use two LEDs as light sources and a photodiode as detector.
They are all hand-held devices for non destructive chlorophyll measurements on
thin leaves. Some of them have additional functions, described in the next
section. Transmittance at each wavelength can be estimated as the ratio of the
photodiode signal with the leaf between the jaws and the photodiode signal
with the leaf absent.
The instruments described in @tab-leaf-tfr estimate the concentration of
chlorophyll per unit leaf area based on leaf transmittance. The wavelengths used
both as target and reference for assessing chlorophyll concentration vary across
instruments. A reference is needed to assess the attenuation caused by light
scattering independently of chlorophyll concentration. Differences in the
wavelength used as reference as long as there is no absorption by pigments have
minimal consequences. In contrast difference in the target wavelength are more
significant because a measurement using the wavelength of peak absorption (near
660 nm) even if advantageous when assessing low concentrations makes the
measurement of high concentrations difficult. As concentrations of chlorophyll
in leaves can be high enough to result in very low transmittance, instruments
that use longer wavelengths in the shoulder of the peak instead of at its cusp,
are in most cases preferable. The LSA-2050, MPM-100, Dualex 4 and MC-100 return
approximate concentrations on an area basis while the SPAD-502, MPM-100/S and
some other SPAD clones return "SPAD units". The CCM-200 returns values of "CCI"
index. The relationships between values in SPAD units and chlorophyll
concentration and between values in CCI units and chlorophyll concentration are
both curvilinear, but convex in opposite directions [@]. The _in vivo_
chlorophyll concentration estimates must be in general considered as
approximate. For example, comparison of values obtained from leaves with
differences in leaf anatomy, require in most cases separate calibrations for
accuracy.
| Instrument | Target | Reference | Quantity | Area |
|:-----------|:-----------|:-----------|:-----------|:-----|
| LSA-2050 | 715 (25) | 770 (30) | conc. | 79/28 |
| MPM-100 | 720 | 850 | conc. | 71 |
| MPM-100/S^*^ | 650 | 940 | SPAD index | 71 |
| Dualex 4 | 720 | 810? | conc. | 20 |
| MC-100^*^ | 650 | 930 | conc. | 71 |
| CCM-200^*^ | 650 | 930 | CCI index | 71 |
| SPAD-502^+^ | 650 | 940 | SPAD index | 6 |
: Instruments for the non-destructive measurement of chlorophyll concentration
based on leaf transmittance. Target and reference wavelengths, full width half
maximum (FWHM) given in parentheses when available. Quantities are approximate
concentrations or indexes with arbitrary units. The measured area is given in
$\mathrm{mm}^2$ and in the case of the LSA-2050 can be reduced with a supplied
mask for use on small leaves. Notes: ^*^no user experience by author.
^+^The SPAD-502 and SPAD-502 Plus, are identical except for the data logging
available in the Plus version. The
MPM-100 is available in customized versions based on LEDs emitting at
non-standard wavelengths. The Walz LSA-2050 measures in addition to
transmittance chlorophyll fluorescence $Fv/Fm$.
The readings are expected not to depend on which side of the leaf is
illuminated. In fact, the Dualex 4 and the LSA-2050, measure transmittance in
opposite directions through leaves. The Dualex has the LEDs in the upper jaw and
the sensor in the lower one, while the LSA-2050 locates them the other way
around. Like the Dualex, the SPAD-502, MPM-100, MPM-100/S, CMM-200 and MC-100
have the LED in the upper jaw.
The Walz LSA-2050 is aimed at scientific research, with built-in support for
recalibration and corrections for different types of leaves. The Dualex 4 aims
at being both useful in research and as a tool for crop management. The
MPM-100 seems to target the same users as the Dualex 4. The CMM-200,
MC-100 and specially the SPAD-502 are marketed as tools for crop management,
although they are in practice also frequently used in plant research.
The indexes are given by [@Parry2014] as:
$$\mathrm{SPAD} = k \times \log \frac{T_{940}}{T_{650}} + C$$
where $k$ and $C$ are calibration constants.
$$\mathrm{CCI} = \frac{T_{931}}{T_{653}}$$
Even if the reading from the SPAD is a value rather similar to absorbance, it is
not linearly related to concentration of chlorophyll in the measured leaves.
@Markwell1995 proposed building a calibration curve to convert SPAD units into
chlorophyll concentration by fitting a non-linear function of the form:
$$y = 10^{x^k}$$
where $x$ is the reading in SPAD units and $y$ the concentration of chlorophyll
per unit leaf area. The value of $k$ depends on the individual SPAD instrument
and obviously also on the units in which the chlorophyll concentration is
expressed. @Markwell1995 described the value of $k$ as more dependent on the
instrument than on the plant species or genotype. However, differences in
anatomy can be expected to affect the relationship between transmittance and
concentration, independently of the instrument used. The advantage of using
this function compared to a polynomial or spline, is that it constrains the
shape of the curve, which is important when calibrations are based on limited
data.
### Epidermal transmittance
Fluorescence is dependent on the number of absorbed photons, this also
applies to chlorophyll. Thus, a measurement of fluorescence behind the
epidermis, from the chlorophyll in the mesophyll, can be used to
estimate the transmittance of the epidermis if it is possible to
estimate the fluorescence yield that can be expected in the absence of
the epidermis. One approximation is to use a wavelength that is known
not to be absorbed by the epidermis to obtain a reference value of
fluorescence. This value can be compared against fluorescence excited
by other wavelengths where the epidermis can absorb.
This the principle of the Dualex (dual excitation), similar to the earlier
approach used by the UVA-PAM, a modified Walz Mini-PAM. The Dualex, however,
measures the fluorescence on the opposite side of the leaf from the excitation,
while the UVA-PAM and the Walz LSA-2050 measure the fluorescence from the side
of the leaf where the excitation light impings. While the Dualex can be used
only on thin leaves, the UVA-PAM and the LSA-2050 can be used on thicker objects
like fruits. In the case of the LSA-2050 by
removing the lower jaw, which contains the light sources for
estimation of chlorophyll based on transmittance across the leaf. The UVA_PAM
uses a single light guide, and does not measure transmittance.
The MPM-100 senses the chlorophyll fluorescence on the same side of the
leaf as the excitation impings. However the head has a maximum opening
that limits its use to thin objects like leaves.
The instruments described in @tab-epidermis-tfr use LEDs as light sources and
photodiodes, in most cases filtered, as detectors. They are hand-held devices
for non destructive measurements of thin leaves, and in some cases also suitable
for thick leaves, fruits and stems. Walz's Xe-PAM in the exception, it uses a
filtered Xenon lamp as light source and a photo-multiplier tube as detector, is
not handheld and usually used in a laboratory.
The instruments in @tab-epidermis-tfr rely on the excitation of chlorophyll
fluorescence with its intensity used as reporter inside the leaf for estimation
of the transmittance of the epidermis. All the Dualex instruments sense the
fluorescence on the opposite side of the leaf to the excitation, while other
instruments sense it on the same side. These instruments differ in the target
and reference wavelengths used for assessing epidermal transmittance. The
different transmittances depend on the accumulation of different metabolites:
UV-B, phenolic acids, UV-A1, flavonoids, blue, non-photosynthetic-related
carotenoids, green, anthocyanins. Either blue- or red-excited fluorescence is
used as reference assuming that these wavelengths are minimally absorbed in the
epidermis.
| Instrument | UV-B | UV-A1 | Blue | Green | Red^**^ |
|:-----------|:-----------|:-----------|:-----------|:-----------|:-----------|
| LSA-2050 | 310 (15) | 365 (12) | 450 (14) | 530 (27) | 630 (24) |
| MPM-100 | | 375 | | 525 | 660 |
| MPM-100/S^*^ | | 375 | | 525 | 660 |
| Dualex 4 | | 375 | | 520 | 630 |
| Dualex 3 FLAV | | 375 | | | 630 |
| Dualex 3 ANTH^*^ | | | | 520 | 630 |
| Dualex 3 CA | 310 | | | | 630 |
| UVA-PAM^*^ | | 375 | 470 | | |
| UVA-PAM/red^*^ | | 375 | | | 630? |
| Xe-PAM^*^ | 314 (18) | 366 (32) | 475 (140) | | |
: Instruments for the non-destructive measurement of epidermal transmittance
using chlorophyll fluorescence as reporter. Excitation wavelengths, full width
half maximum (FWHM) given in parentheses when available. Instruments names
followed by ^*^ indicate that the author has no direct experience in their use.
The MPM-100 is also available in customized versions based on LEDs emitting at
non-standard wavelengths. The Walz LSA-2050 measures in addition to
transmittance chlorophyll fluorescence Fv/Fm.
## Leaf reflectance
The instruments described in @tab-leaf-rfr measure reflectance of leaves, each
at a pair of wavelengths. These reflectance values can be combined into indexes
that are correlated to specific plant conditions. These indexes are typically
used in remote sensing but instruments for their measurement on individual
leaves are also available. NDVI and NDGI mainly assess how green vegetation is
while PRI assesses differences within the green region of the spectrum.
| Instrument | Target | Reference | Quantity |
|:-----------|:-----------|:-----------|:-----------|
| PlantPen NDVI 310^*^ | 660 | 770 | NDVI |
| PlantPen PRI 210^*^ |531 | 570 | PRI |
| PlantPen/NPen N 110^*^ | 560 | 780 | NDGI |
: Instruments for the non-destructive measurement of indexes based on leaf
reflectance. Excitation wavelengths, full width half maximum (FWHM) given in
parentheses when available. Instruments names followed by ^*^ indicate that the
author has no direct experience in their use.
A significant part of light "reflected" from a leaf is scattered light that
has traveled inside the leaf and been partly absorbed by pigments, rather than
reflected at the leaf surface. Thus, similarly to transmittance, reflectance
at specific wavelengths, can inform about pigments within leaves. The PlantPen
instruments from PSI, as well as remote sensing, RGB and spectral imaging of
vegetation rely on this phenomenon.
All of the instruments described in @tab-leaf-rfr return values that are indexes
rather than concentrations. The indexes as implemented in these instruments are:
$$\mathrm{PRI} = \frac{R_{531} – R_{570}}{R_{531} + R_{570}}$$
$$\mathrm{NDVI} = \frac{R_{660} – R_{770}}{R_{660} + R_{770}}$$
$$\mathrm{NDGI} = \frac{R_{560} – R_{780}}{R_{560} + R_{780}}$$
where $R_\lambda$ is reflectance on a band centred at a given wavelength in
nanometres. The half maximum full width (HMFW) of the excitation is not given
in the specifications. There are variations on the exact wavelengths and
HMFW used for these indexes that are in wide use, and this must be taken into
account when comparing measurements.
There are indexes like NBI that combine different types of measurements, and
these can be obtained only with the more advanced instruments, Dualex 4 and
LSA-2050. The Nitrogen Balance Index (NBI) is obtained by dividing the
chlorophyll concentration index ($\approx \mu g\, cm^{-2}$) by the epidermal
flavonols index, AFLAV ($\approx A_{375}$) (using inconsistent units), to obtain
a value sometimes described as "unitless".
## Alternative approaches
With a spectrometer it is possible to measure whole leaf spectral reflectance
and transmittance, and from them derive absorptance over arbitrary wavelength
ranges within the overlapping sensitivity range of the spectrometers and the
wavelength range of the illumination. The measurement of epidermal transmittance
with a spectrometer is limited to the few species in which the epidermis can be
stripped from leaves and measured by itself.
Ocean Optics used to make a portable spectrometer equipped with small
integrating spheres in a clip-like arrangement with one sphere in each jaw.
In use one should be aware that two spheres collecting light and reflecting it
back onto the leaf can result in erroneous readings as some light can travel
back and forth across the leaf. This must be taken into consideration in the
measuring protocol used, but it is not a design flaw.
I should mention here also the *SpectraVue Leaf Spectrometer* from CID
Bio-Science. This is a **badly designed** instrument that returns **bad
data**. It should not be used in scientific research. First it suffers
from extreme problems of dark noise and stray light, as can be seen in
the images in the company's own advertising. More importantly, because
of the light source used and the configuration of the instrument
entrance optics the sum of reflectance, transmittance and absorptance
reported is very far from the theoretical value of one, and much larger,
i.e., the values reported as reflectance, transmittance and absorptance,
are not these physical quantities! (The company has been aware of these
design problems for several years, as they recognized when I reported
them several years ago in a exchange of several e-mails.)
## Instruments
### Ergonomics and usability
The first impression of the *Walz LSA-2050* is that of a refined design
and very well tested instrument, making it reliable, ergonomically easy
to use and with very well thought out and clear firmware user interface.
In some respects it benefits from Walz's long experience in chlorophyll
fluorescence measurements, as well as from the approaches used in the
Dualex instruments. The *LSA-2050* does the measurements very fast. With
the help from its good ergonomics, I was able to measure 15 leaves, each
from a different plant, across four growth-chamber shelves in 4 min.
The *MPM-100* is not really a clone of the Dualex in its measurement approach
but attempts to be a replacement for it. At least the version I have used, has a
display with very small text, even if in colour, and some significant rough
edges in the firmware user interface. The most important being that when a
measurement fails, the screen displays the results from the last good
measurement, which is prone to cause mistakes in the manual recording of
readings. Another quirk is that when the estimation of one parameter fails the
MPM-100 returns no results, which is problematic. In contrast, the Dualex
reports those values that could be measured. The MPM-100 is also slower than the
Dualex as it averages several consecutive measurements.
The *Dualex 4* is also a well designed instrument, a refinement of the
earlier *Dualex 3* series. It has a couple weak points, though: the hinge is
rather weak and with long-term use can develop play or even break. In the
first case some misalignment of the two halves of the measurement head
can occur. The Dualex has more options for encoding treatments than the
Walz, making it more cumbersome, but more flexible in the tagging of
logged data.
The *SPAD-502* is no longer available in the simple version I have used.
The *SPAD-502Plus* with data logging capabilities is also a well
designed and easy to use instrument. I have not used any of the cheaper
clones.
### Cost and availability
| Instrument | Handheld | Make | Availability |
|:-----------|:-----------|:-----------|:-----------|
| LSA-2050 | y | Walz | 2024- |
| MPM-100 | y | Opti-Sciences | |
| MPM-100/S | y | Opti-Sciences | |
| Dualex 4 | y | Force-A | |
| Dualex 3 FLAV | y | Force-A | |
| Dualex 3 ANTH | y | Force-A | |
| Dualex 3 CA | y | Force-A | |
| UVA-PAM | y | Walz/ | |
| UVA-PAM/red | y | Walz/ | |
| Xe-PAM | n | Walz | |
| SPAD-502 | y | Konica/Minolta | |
| PlantPen NDVI 310 | y | PSI | |
| PlantPen PRI 210 | y | PSI | |
| NPen N 110 (NDGI) | y | PSI | |
| MC-100 | y | Apogee | |
| CCM-200 | y | Opti-Sciences | |
: Instruments for the non-destructive measurement of leaf optical properties related to metabolite concentrations.
The *SPAD-502Plus* sells for 2500-3000 €, with various clones available in the
range 600-1500 €. The *Dualex 4*, now Metos from Pessl after the bankruptcy of
Force-A, costs close to 4500 €, the *MPM-100* costs close to 3000 € and the
*Walz LSA-2050* costs close to 6000 €. (These prices are approximate as they
vary depending on supplier, import taxes, etc., as well as with accessories
ordered and in some cases with the instrument configuration).
## Instrument tests and intercomparisons
| Instruments compared | Measured | Variation from | Reference |
|:---------------------|:------------|:------------|:----------|
| SPAD-502, MC-100, Multiplex 3.6, atLEAF+ | Chl | Nitrogen supply | @Padilla2018 |
| SPAD-502, CCM-200, Dualex 4 | Chl | Four crops | @Dong2019 |
| SPAD-502, CCM-200 | Chl | 22 species | @Parry2014 |
| SPAD-502, Dualex | Chl + Flav | Multiple | @Meyer2006 |
| Dualex 4, LSA-2050, UV-A-PAM | Chl + Flav + Anth | Irradiance | @Bilger2026 |
## Data logging and data exchange
In this section I only discuss equipment that I have used and are capable of
storing data.
### Dualex 4
### MPM-100
The MPM-100 logs measurements to its internal memory. It logs both computed values and raw values. The computed values are calculated based on instructions in a script, with a default script preinstalled. The data are downloaded as a single Excel worksheet. The values in the worksheet are numerical, not equations, simplifying import of the data.
I could not find in the documentation information on whether the excitation is at constant irradiance or if it varies depending on how much is the fluorescence yield. Knowing this would be of interest when when interpreting the raw fluorescence values.
### LSA-2050
The LSA-2050 logs measurements to its internal memory and these data can be downloaded as an Excel workbook using a Windows program provided for free with the instrument and also available for download in its current version. The worksheets contain both hidden and visible values. Many of the values are computed by formulas in the worksheet, something that makes import more complex. The worksheets as returned by the LSA software do seem to contain bare formulas, without cached computed values.
The computed values are necessary for import into foreign software such as R. Thus, the calculated values need to be added to the worksheets. The workbook is compatible with LibreOffice, but in contrast to Excel that automatically calculates the values on file load, in LibreOffice a hard recalculation needs to be manually triggered to have the computed values displayed instead of zeros. After saving the file it can be imported into R. At the moment, Linux and Mac OS X users are out-of-luck as no software for data download is yet available.
There are multiple R packages capable of reading Excel worksheets from workbooks. The first package I tried was the popular 'readxl' and it worked on my first attempt. However, the data are in two separate worksheets within a workbook.
::: callout-attention
When computed values for formulas are not present, the cells are displayed filled with zeros. If precomputed values are lacking reading the file into R also results is the import of zeros instead of the computed values.
:::
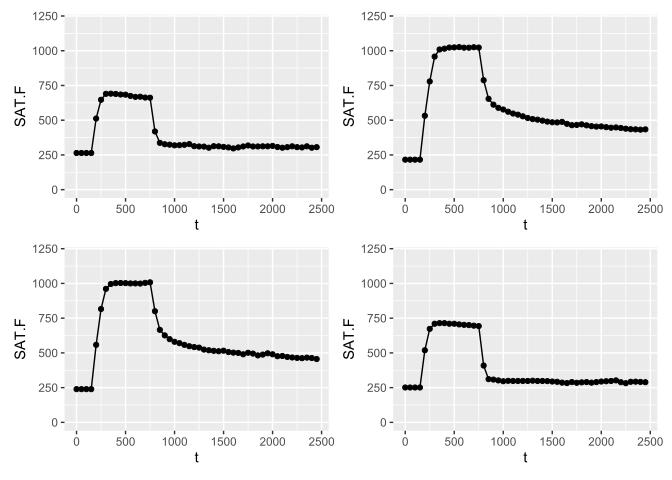
The data in the "SAT chart" worksheet are time series with time points along rows, which is not how plotting functions of R expect the data to be organized. Because of this, even if the Excel worksheets can be easily read into R, additional processing is needed. In addition, in many cases only the computed values are needed for statistical analysis and plotting in R, making sub-setting necessary after import.
I have added function `read_walz_lsa_xlsx()` to package 'photobiologyInOut'. This function reads the worksheets, checks that the computed values are available, and if not replaces the filler zeros with `NA` markers with a warning. The data from both worksheets are combined into a single data frame. The SAT time series are stored in one data frame per sample, nested inside the main data frame containing all raw and computed data for each sample in one row. Different subsets of the data in the workbook can also be imported when not all data are needed.
### Example
```{r}
library(dplyr)
library(photobiologyInOut)
library(ggplot2)
library(ggpmisc)
library(patchwork)
```
```{r}
faba_light_before.df <-
  read_walz_lsa_xlsx("lza-dualex-mpm-data/faba-light-before.xlsx")
faba_light_before.df$condition <- "light.240min"
```
```{r}
faba_20min_dark.df <-
  read_walz_lsa_xlsx("lza-dualex-mpm-data/faba-20min-dark.xlsx")
faba_20min_dark.df$condition <- "dark.20min"
```
```{r}
faba_35min_dark.df <-
  read_walz_lsa_xlsx("lza-dualex-mpm-data/faba-35min-dark.xlsx")
faba_35min_dark.df$condition <- "dark.35min"
```
```{r}
faba_light_after.df <-
  read_walz_lsa_xlsx("lza-dualex-mpm-data/faba-light-after.xlsx")
faba_light_after.df$condition <- "light.10min"
```
```{r}
faba_191_LSA.df <-
  bind_rows(faba_light_before.df,
            faba_20min_dark.df,
            faba_35min_dark.df,
            faba_light_after.df) |>
  mutate(condition = factor(condition),
         condition = reorder(condition, Time))
```
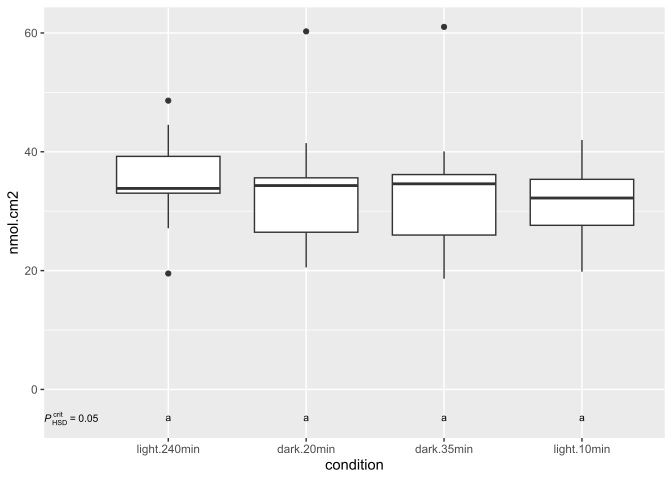
```{r}
ggplot(faba_191_LSA.df, aes(condition, nmol.cm2)) +
  geom_boxplot() +
  stat_multcomp(label.type = "letters", size = 2.7) +
  expand_limits(y = 0)
```
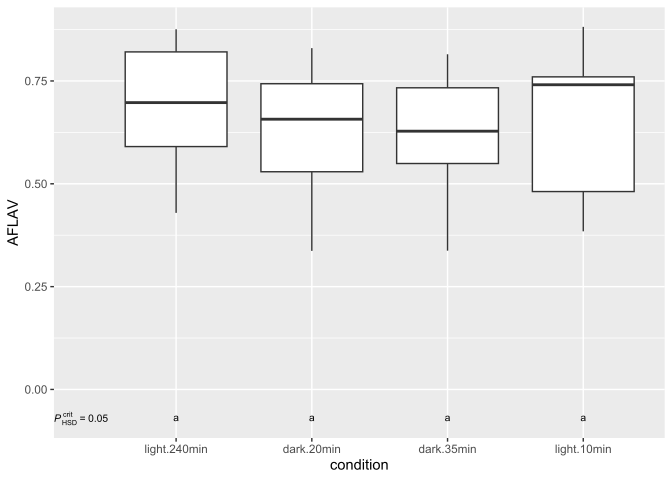
```{r}
ggplot(faba_191_LSA.df, aes(condition, AFLAV)) +
  geom_boxplot() +
  stat_multcomp(label.type = "letters", size = 2.7) +
  expand_limits(y = 0)
```
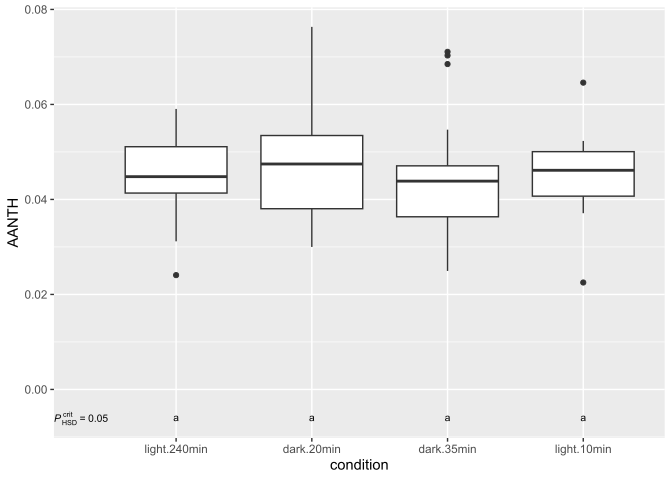
```{r}
ggplot(faba_191_LSA.df, aes(condition, AANTH)) +
  geom_boxplot() +
  stat_multcomp(label.type = "letters", size = 2.7) +
  expand_limits(y = 0)
```
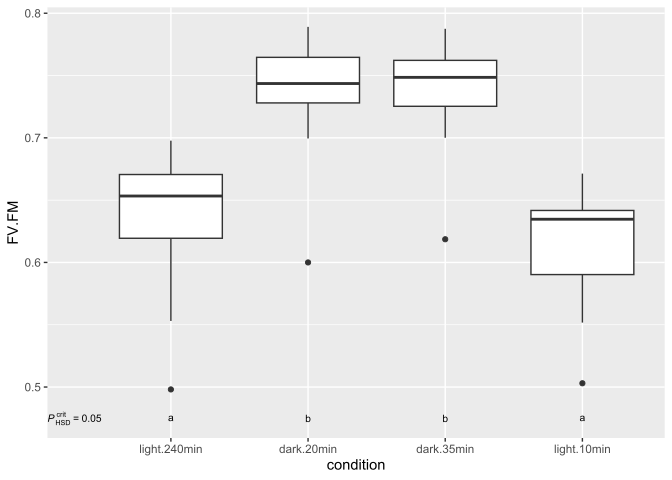
```{r}
ggplot(faba_191_LSA.df, aes(condition, FV.FM)) +
  geom_boxplot() +
  stat_multcomp(label.type = "letters", size = 2.7)
```
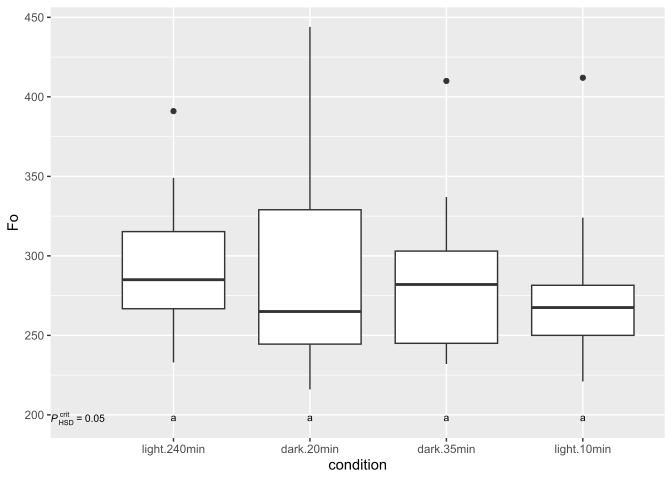
```{r}
ggplot(faba_191_LSA.df, aes(condition, Fo)) +
  geom_boxplot() +
  stat_multcomp(label.type = "letters", size = 2.7)
```
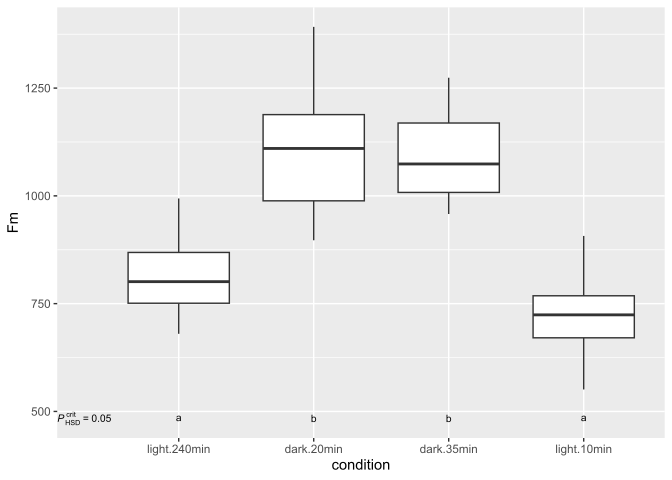
```{r}
ggplot(faba_191_LSA.df, aes(condition, Fm)) +
  geom_boxplot() +
  stat_multcomp(label.type = "letters", size = 2.7)
```
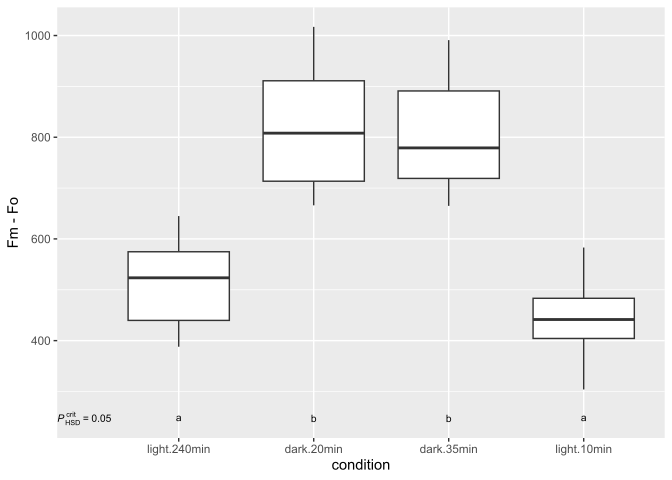
```{r}
ggplot(faba_191_LSA.df, aes(condition, Fm - Fo)) +
  geom_boxplot() +
  stat_multcomp(label.type = "letters", size = 2.7)
```
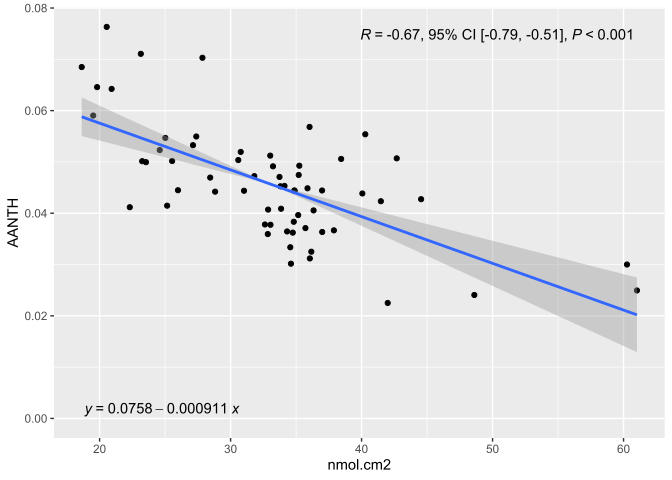
```{r}
ggplot(faba_191_LSA.df, aes(nmol.cm2, AANTH)) +
  geom_point() +
  stat_correlation(use_label("r", "r.confint", "P"),
                   label.x = "right") +
  stat_ma_line() +
  stat_ma_eq(use_label("eq"), label.y = "bottom") +
  expand_limits(y = 0)
```
```{r}
n <- 6 # "plant"

(ggplot(faba_light_before.df$SAT.F.ls[[n]], aes(t, SAT.F)) +
  geom_point() +
  geom_line() +
  expand_limits(y = c(0, 1200))) +
(ggplot(faba_20min_dark.df$SAT.F.ls[[n]], aes(t, SAT.F)) +
  geom_point() +
  geom_line() +
  expand_limits(y = c(0, 1200))) +
(ggplot(faba_35min_dark.df$SAT.F.ls[[n]], aes(t, SAT.F)) +
  geom_point() +
  geom_line() +
  expand_limits(y = c(0, 1200))) +
(ggplot(faba_light_after.df$SAT.F.ls[[n]], aes(t, SAT.F)) +
  geom_point() +
  geom_line() +
  expand_limits(y = c(0, 1200)))
```
### References
::: {#refs}
:::